Information about cases and variants
The cases tab displays case information. All the information displayed in the tab is relative to the case level.
Variants list
A list of variants is displayed at the top of the tab. It allows you to select variants, highlighting them on the diagram on the left.
A variant is a single process where one or more cases pass.
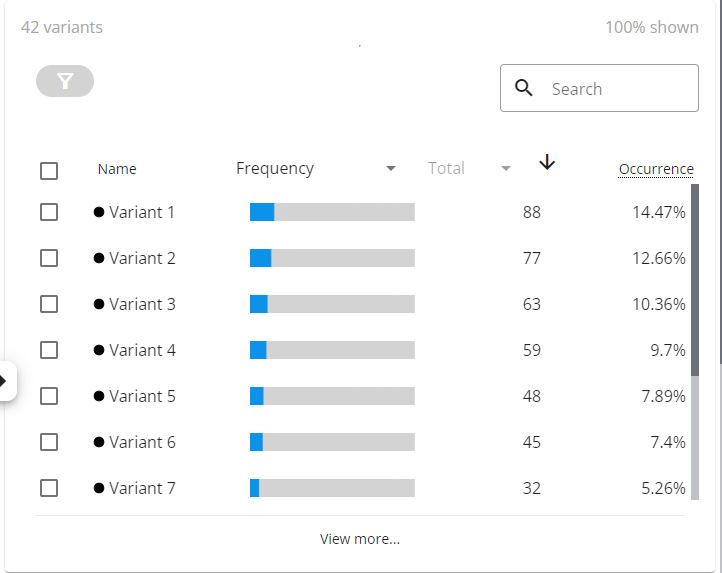
The list contains a lot of different information. To begin with, the header of the list contains 2 pieces of information:
- The total number of filtered variants
- The percentage of selected cases in the list

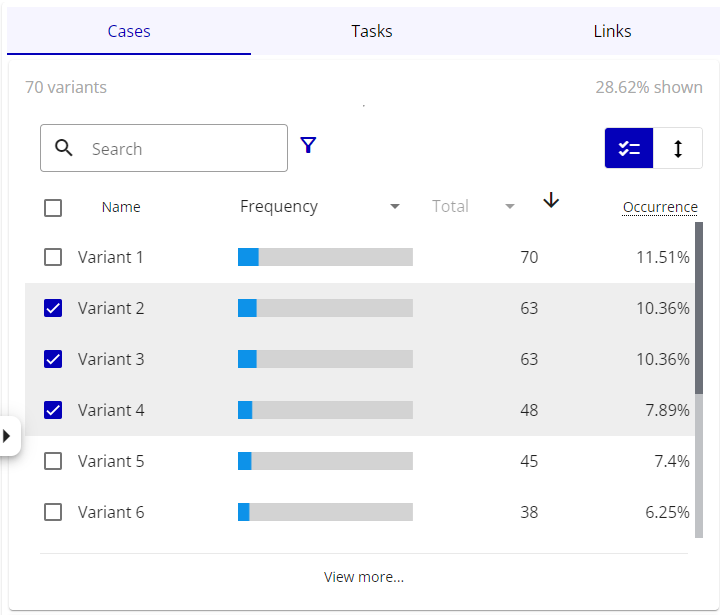
Thereafter, we find (from left to right) a button to filter the selection, a search field based on the name and buttons to toggle the selection mode between checklist and range mode.

Just before the list itself, we find the names of the columns of the list. It features the name, the metric and statistic to display, a button to change the sort order (ascending or descending) and the percentage of cases.

The variants list is a multi-selection list. At initialization only the first 10 variants are displayed, the rest are represented by the Other variants element. To display the next 10 items, click on the arrow at the bottom of the list, the next 10 items will be subtracted from Other variants and added to the list.
A variant in the list has several elements:
- The name of the variant accompanied by an icon indicating whether the variant is displayed entirely/partially or is not displayed.
- A bar acting as a graphical representation of the value of the variant (depending on the metric) on the maximum value.
- The value of the variant itself (depending on the metric and statistic selected)
- The percentage of cases in the variant based on the number of cases in the variant on the total number of filtered cases
Selection modes
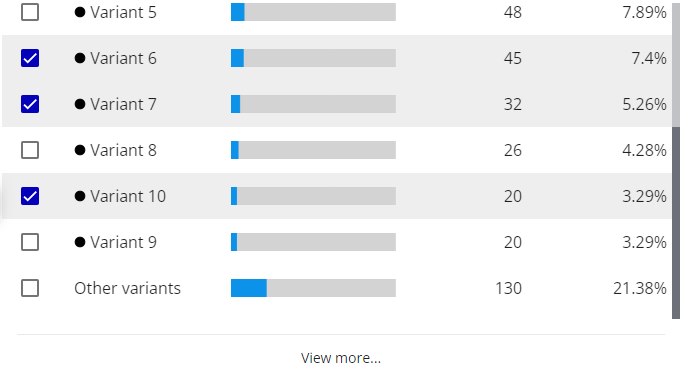
There are 2 modes of selection for elements in the list, you can select elements in the list in one mode and switch to the other anytime.
The first and default mode is "checklist mode", you can select any elements from any order.
The second mode is "range mode", this mode allows to select more easily a range of values throught the use of a slider.
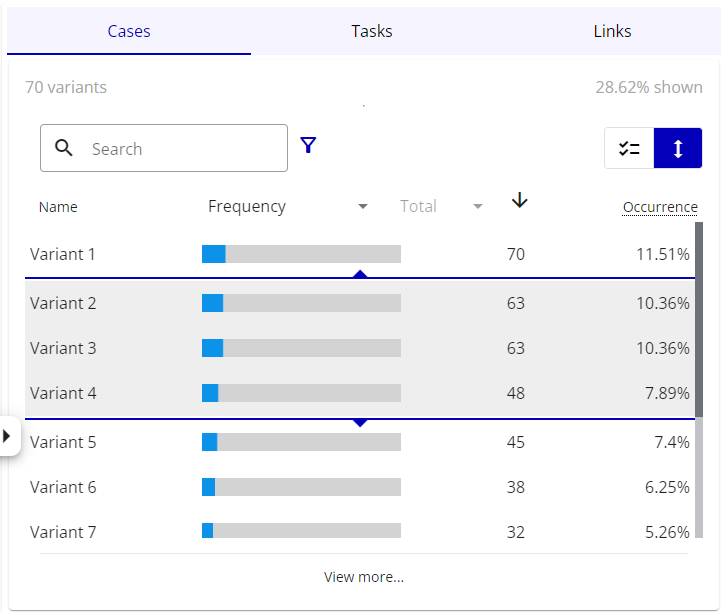
Switching from "checklist mode" to "range mode" will keep your selection only if you've selected successive elements.
Information widgets
Several informational widgets are displayed below the variants list.
Concurrency widget
Displays the selected cases concurrency rate.

Rework widget
Shows the average cases rework (the number of times a task is done in the same case).

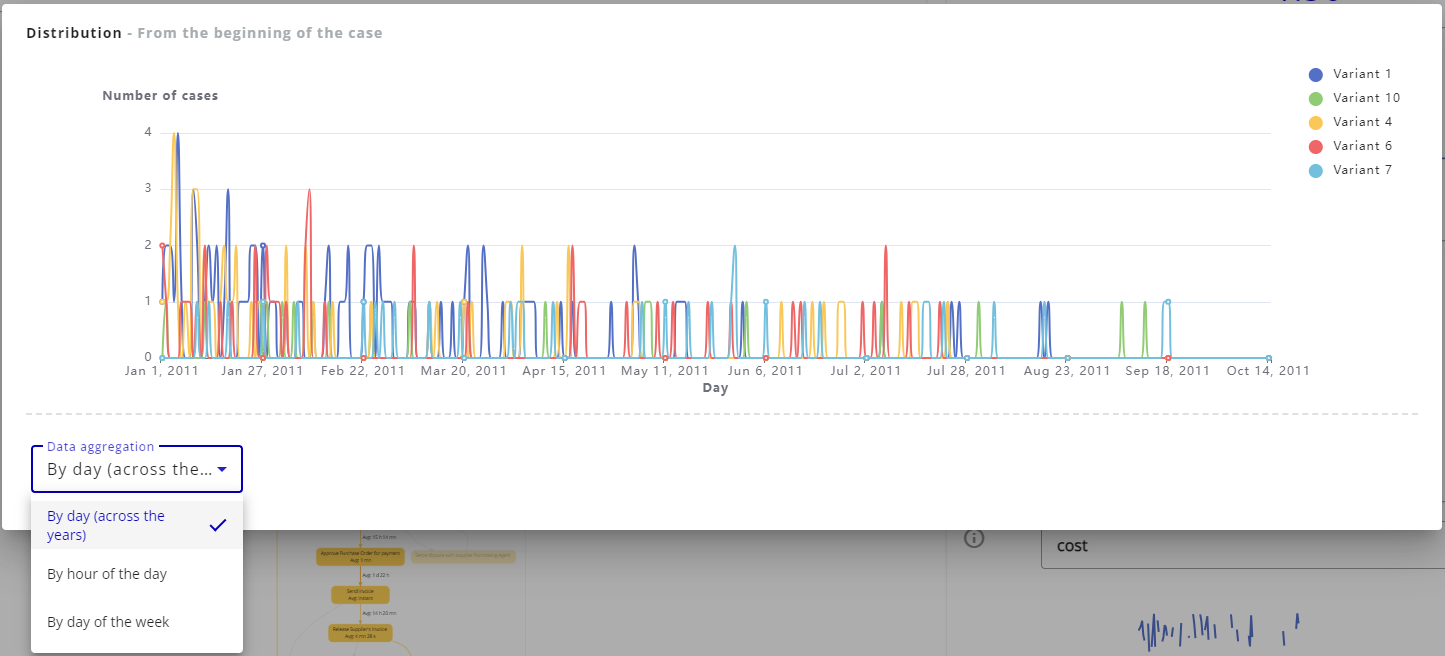
Distribution widget
Shows the distribution of cases over time from the start of the case. By opening the widget wide you can aggregate the data either by day, day of the week or hour of the day. Up to 5 series can be displayed at the same time.

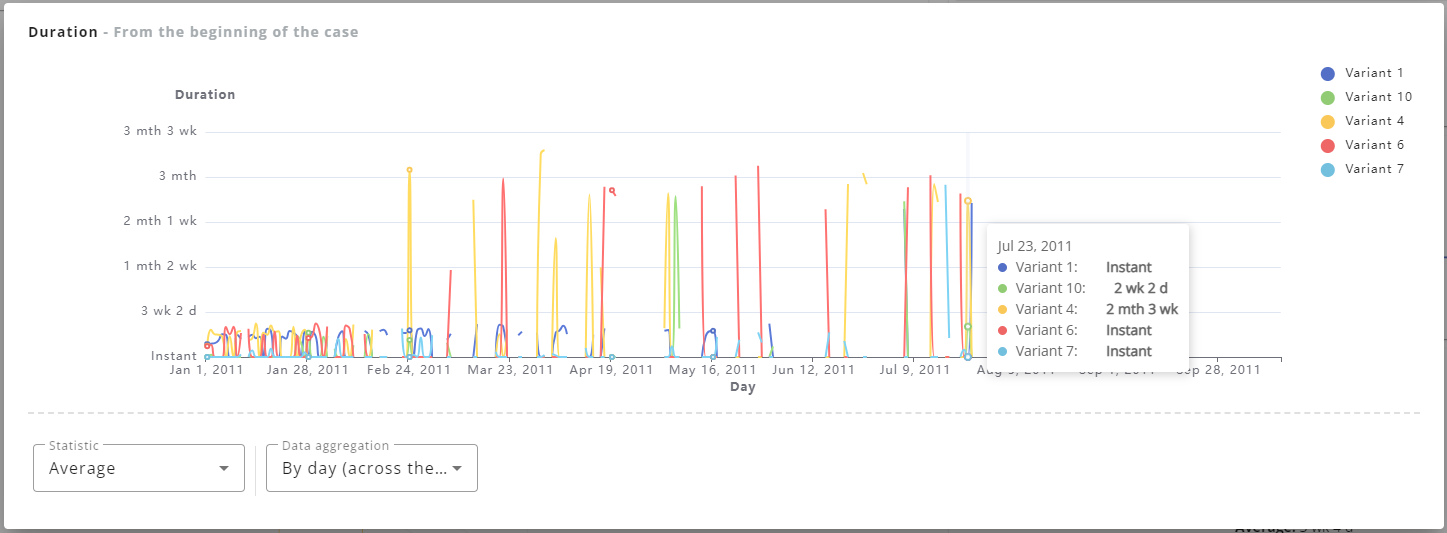
Duration widget
Shows the evolution of case duration over time from the case start date. By opening the widget in large you can aggregate the data either by day, day of the week or hour of the day as well as change the statistics (default Average). Up to 5 series can be displayed at the same time.

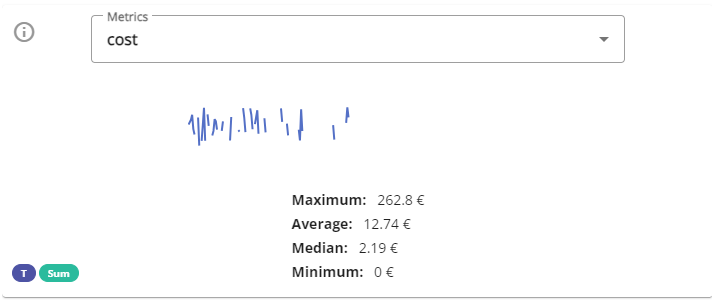
Metrics widget
Only displayed if case or task metrics with aggregation are available!
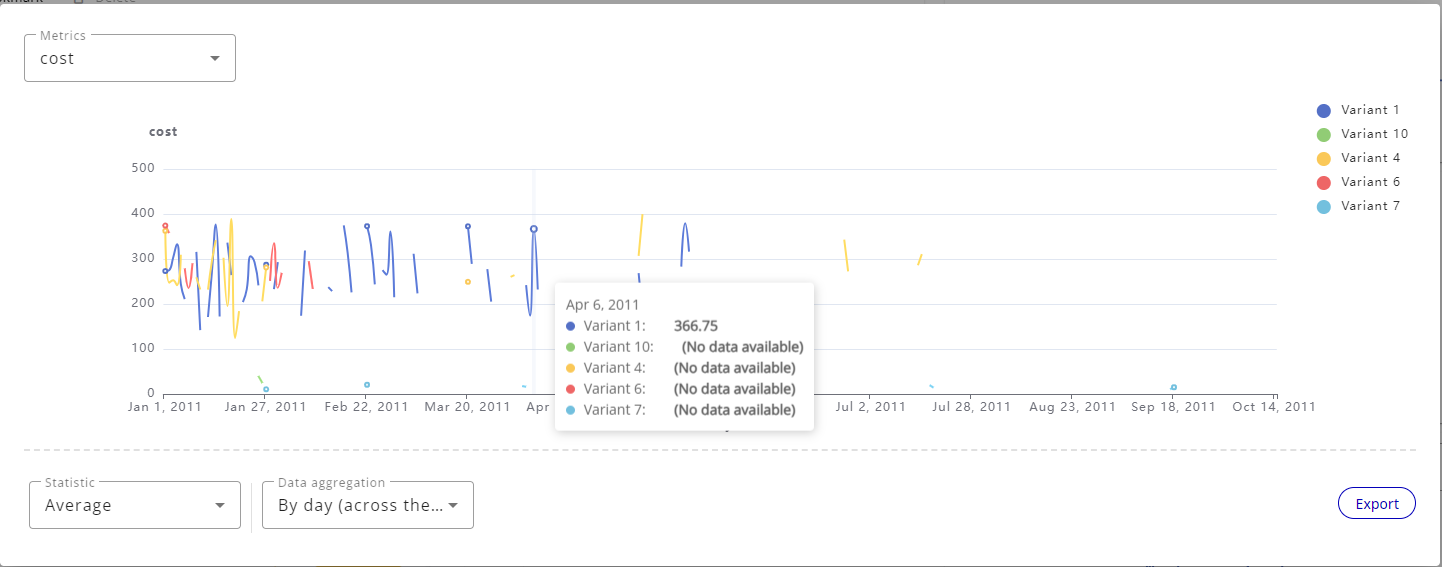
Shows the values of other metrics, which have case-level aggregation, over time. The tags at the bottom left of the widget show whether the metric is a case or task metric as well as the metric it is aggregated on at the case level.
By opening the widget in large you can aggregate the data either by day, day of the week or hour of the day as well as change the statistics (default Average). Up to 5 series can be displayed at the same time. You can also export metric data as a CSV or Excel file.
You can select which other metric to display. They are available in the selection menu at the top of the widget or window.
Dimensions widget
Only displays if case or task dimensions with aggregation are available!
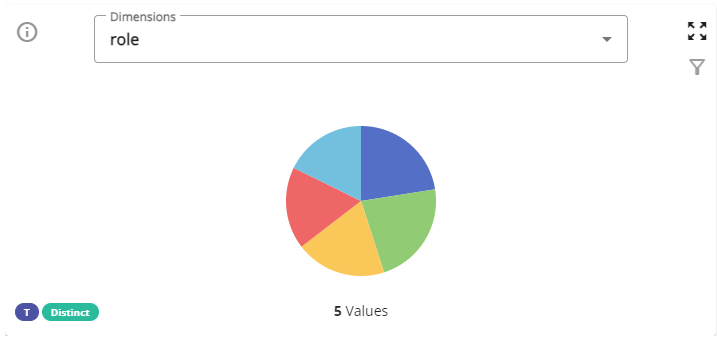
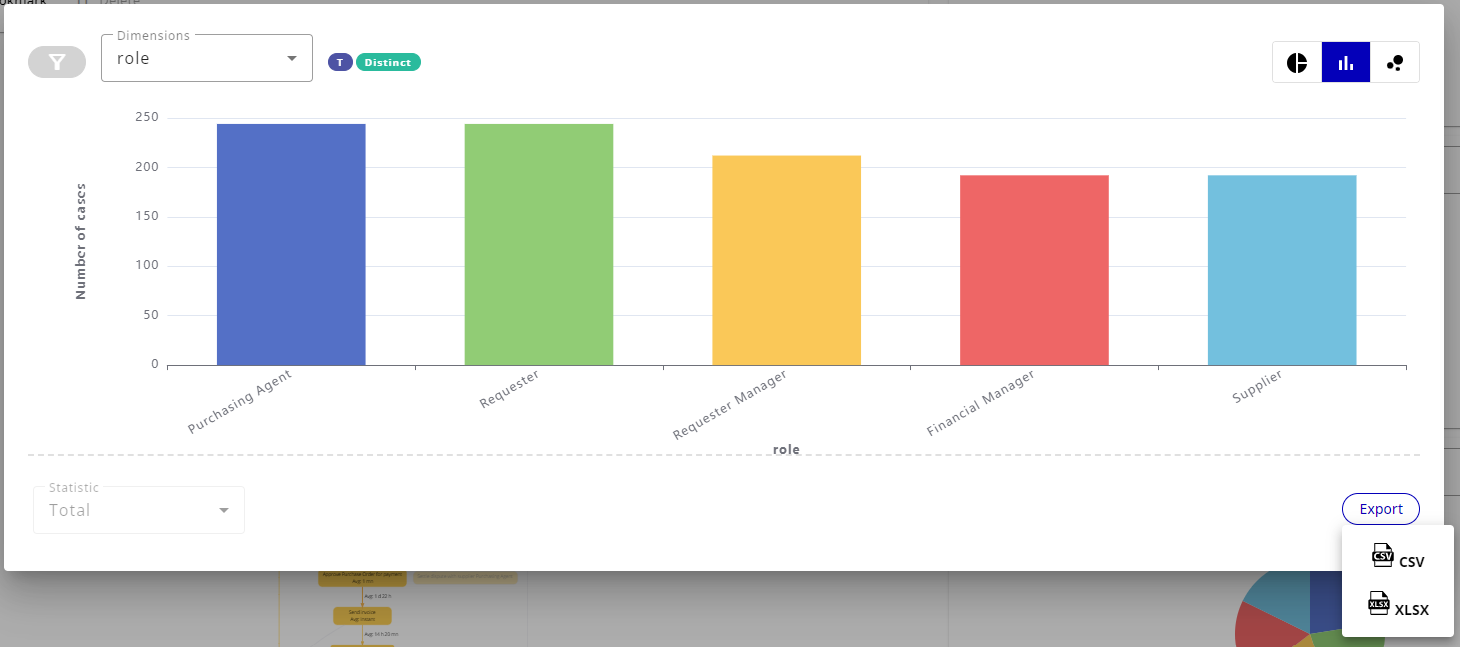
Shows the distribution of values for other dimensions. The tags at the bottom left of the widget (and at the top of the window) show whether the metric is a case or task metric as well as the statistic on which it is aggregated at the case level.
By opening the widget in large you can see the distribution of values in 3 different forms (piechart / barchart / bubblechart). On the piechart and barchart you can directly select values from the chart to create a Dimension filter. You can also export dimension data as a CSV or Excel file.
You can select which other dimension to display. They are available in the selection menu at the top of the widget or window.
