Process view
The process view is the left side of the Analysis page. It displays the processes discovered according to the current filtering.
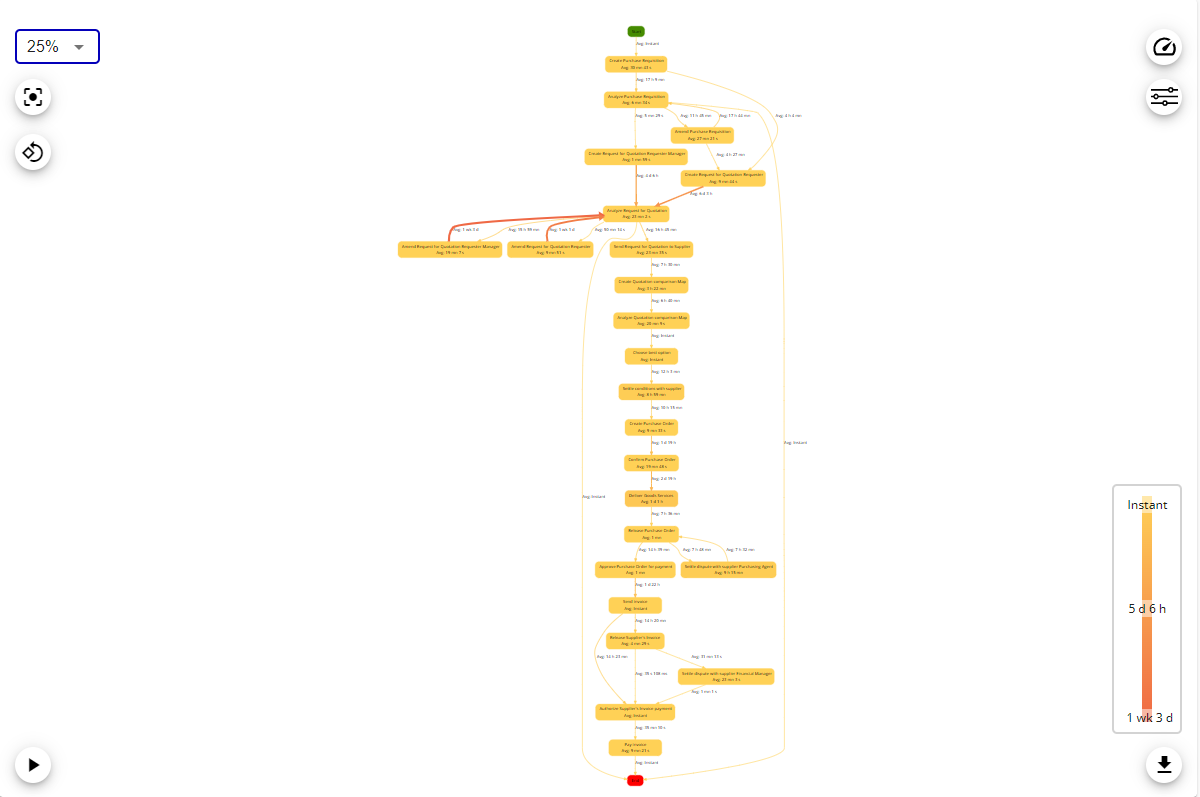
The view is interactive and has several action buttons:
Zoom, recenter, orientation and animation buttons
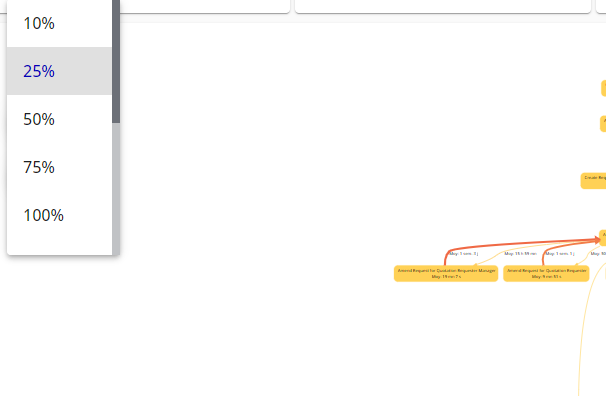
These buttons interact on the presentation of the view. The zoom button allows for more or less zoom on the view through a zoom percentage selection.
The recenter button recenters the view to be able to see the diagram in its entirety.

The orientation button changes the display orientation of the view. The view can switch from a so-called Portrait to Landscape orientation.

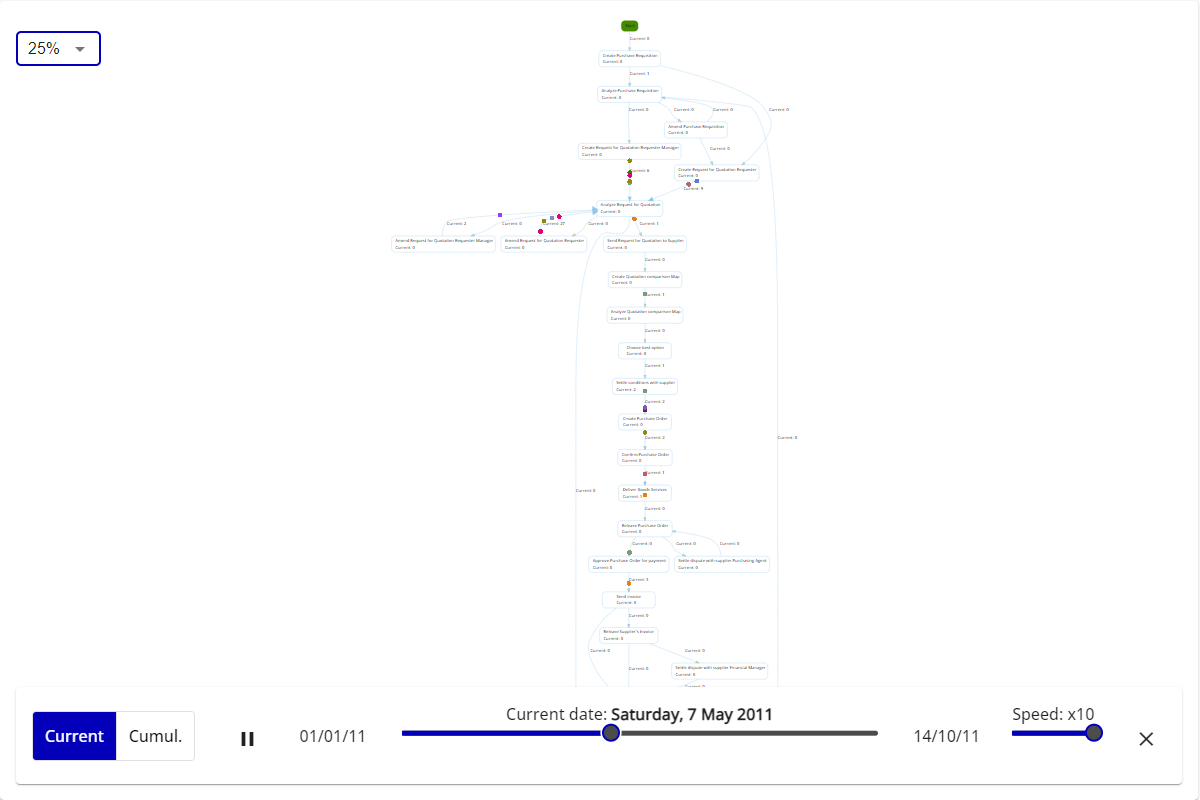
The animation button allows you to launch the animation option, it allows you to see the cases of the processes running throughout the project.
Complex view, metrics/statistics and exports
These buttons each open a menu.
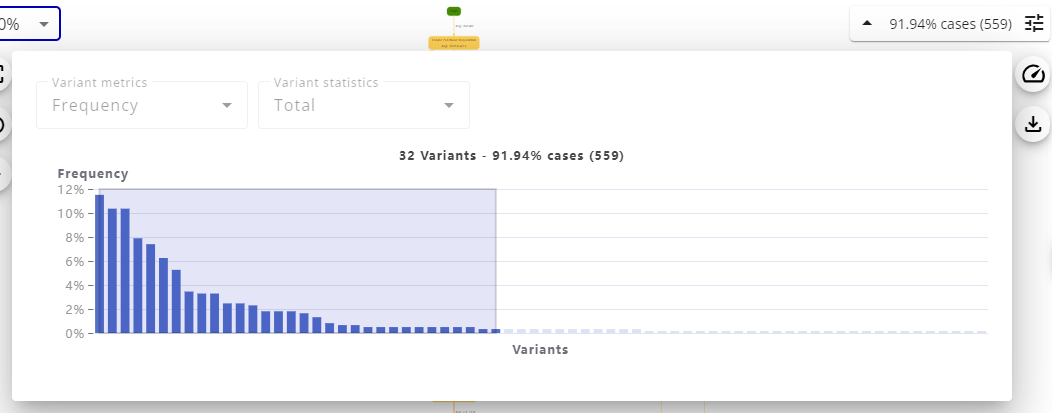
The first button opens a menu to control the complexity of the displayed view. The menu is based on the display of variants, a barchart represents the variant repartition from most to less frequent. You can select the variants you want to show on the view thanks to the slider on the barchart, if you have more than a 100 variants a zoom slider will be displayed below the x axis of the chart.
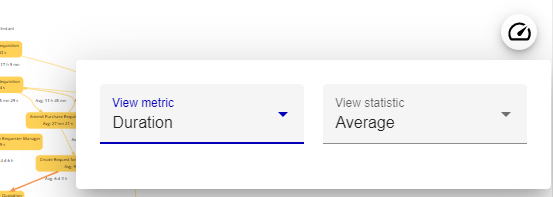
The second button opens the menu allowing to change the metric and the statistic displayed on the view, simply select among the proposed options which one to display and the view will be reloaded with the new information.
The third button brings up a menu allowing you to export the view as a PNG or SVG image, to export the associated data to CSV or to export the model of the processes displayed in BPMN format as a local file or directly to Process Design (if the workgroup is linked to repositories).
See help page on exports